
Download Using_Mango.pdf
Introduction
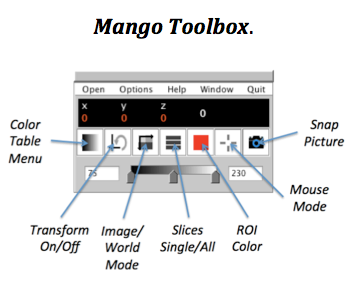 A large amount of information is needed to effectively analyze tomographic biomedical images acquired using magnetic resonance imaging (MRI), x-ray computed tomography (CT), positron emission tomography (PET), and single photon emission computed tomography (SPECT). Knowledge of anatomy, physiology, health of the subject(s), and imaging modality (MRI, CT, PET, SPECT, etc.) are clearly important, as these are needed to define study objectives and guide analyses. However, an understanding of how medical images are stored, displayed, and analyzed can extend the range of information one can obtain from biomedical images. Also, many image analysis tools are available, and it is the task of the image analyst to select those that best address their needs. As such the user should be aware of the purpose, capabilities and limitations of available image analysis tools. The image analyst should have a clear understanding of image display and analysis methods. In Mango the focus is on visualization and analysis of 3-D images, so these will be used to provide examples of its display capabilities and analysis procedures. It would be very helpful to use Mango and follow along with these examples while reading. When Mango is started a Toolbox is displayed with basic menus for opening images, setting options, getting help, selecting windows and specific control icons.
Image Basics
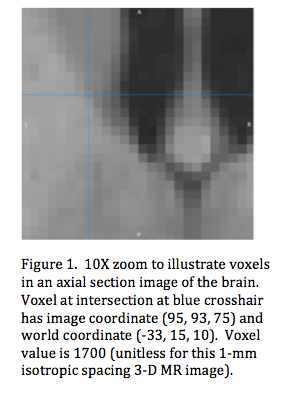 A biomedical image can be thought of as a scaled model of a biological object that has a limited field of view spanning a subset of the object (i.e. head, abdomen, knee). Digital 3-D images (also called volumetric images) are divided into small equal-sized volume elements called voxels (Figure 1). A voxel's location is designated by its column, row, and slice position. A voxel has two other properties: volume and value. Its volume is equal to the product of its row-col-slice dimensions (mm3). A voxel's value may be parametric (CT number, T1, T2, cerebral blood flow) or a relative (MRI signal strength, SPECT counts). Voxel values are stored in image files and organized such that each value can be accessed using (col, row, slice) indices.
It is important to distinguish slice thickness, as acquired by a tomographic imaging system, from slice spacing. For example, an MR image might be acquired using 1x1x5 mm tomographic slices with a 1-mm gap between slices. In this case the acquired volume is 1x1x5 mm3 but the spacing needed for accurate display and processing is 1x1x6 mm3. In this example signals from tissues within the 1-mm gap are missing, which can be problematic for studies when subject scans must be repeated, since the gap will likely be positioned differently at each imaging session. For tomographic studies with large slice spacing compared to within-slice spacing, the precision in spatial measurement is much poorer in the slice direction. When spatial measurements are the goal (volumes, areas, distances, etc.) images should be acquired using small isotropic spacing, preferably 1-mm or less, such that accuracy does not depend on orientation.
Image slice, column, and row spacing and extent can be modified using a process called 'reslicing' (File/Save As...,/Reslice). Voxel spacing in a resliced image is under the control of the user. Voxel values for slices falling between the original slices are calculated using interpolation. Three interpolation options are provided: 1) Nearest Neighbor, 2) Trilinear, and 3) Sinc. We suggest using nearest neighbor interpolation for studies where the voxel values need to be preserved (i.e. histograms before and after reslicing). Trilinear interpolation works well with many images and is generally a good option when original voxel dimensions are small compared with the imaging systems spatial resolution (FWHM), such as for fMRI, PET and SPECT. Sinc interpolation is reserved for use with higher resolution images such as anatomical MRI where the voxel dimensions are ~ spatial resolution (1-mm or less). For studies where the summed image value must be preserved (i.e. PET or SPECT to preserve total radioactivity) the sum will need to be adjusted after reslicing. This can be done using Mango's Image Calculator (see here).
Image Data
 Additional data about the image (metadata) are needed to ensure that voxel positions, dimensions, and values accurately represent the object. For example, the association between image directions (col-row-slice) and body directions (x-y-z) and sense must be known. The standard for the human body is that the +x direction is body right, +y direction body anterior, and +z direction body superior; and these are the standards used within Mango. For objects with near symmetry, e.g. left-right brain symmetry, it is critical that L-R orientation be maintained throughout all steps in image processing. This is automatically managed within Mango. Additionally, the physical spacing between columns, rows, and slices, and the unit of measure (mm) for each must be known. Without these metadata, the displayed image shape may be wrong and measurement of 'physical' distances, areas, and volumes is not possible. Finally, to determine a voxel value we need to know its data type (number of bits 8, 16, 32; integer or float; signed or unsigned and byte order) and its unit of measure.
These critical metadata are documented and recorded at the time the image is acquired by the biomedical imaging system and stored in a portion of the image file called the 'header'. Most biomedical imaging systems store images using a DICOM file format. Other popular formats include NIfTI and Analyze. Image files with the same voxel data and header information can be organized in different ways, but Mango supports most medical image file formats.
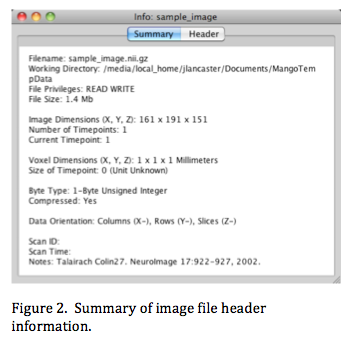
When an image file is opened certain header data are necessary for processing and display. In Mango image voxel values are loaded into a 32-bit floating-point array, indexed using (col, row, slice) addressing. The image header summary in Figure 2 indicates that the image data were stored in (X, Y, Z) body order where columns (1st dimension) are along X, rows (2nd dimension) along Y, and slices (3rd dimension) along Z. There are 161 columns, 191 rows, and 151 slices. The 'Data Orientation' tag indicates the sense of image-to-world mapping. In this example increasing the column number is from right to left (toward '-x'). Similarly, increasing row number is anterior to posterior (toward '-y') and increasing slice number is superior to inferior (toward '-z'). In Mango all images are represented internally using a single 'standard' orientation. This simplifies image processing since all images will have identical col, row, slice order.
There are several options in the viewer's Edit menu that may be helpful when a new image is opened. The Flip Orientation... option can be used to correct the orientation if it was incorrectly specified or not in the image header. The Origin... option can be used to set a world space origin if the origin is incorrect or missing. The Voxel... option can be used to assign a voxel value at the large crosshair's voxel location. This is helpful for imbedding landmarks that track with the image when a coordinate transform is applied. The Notes... option provides a means to attach a text note to the image. Saving the image will update the origin in the image file header.
When Mango loads a tomographic image it displays the image with body right on the right side of the image (Neurological display by default). This can be changed to Radiological display with body right on the left in the Toolbox Options-Preferences... menu. Note: menu options ending with '...' open another window.