
Download Using_Mango.pdf
Image Calculator
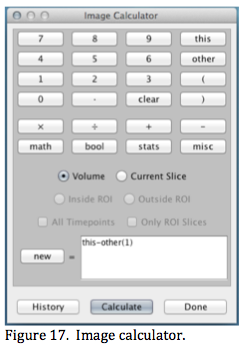 The Image Calculator (found in the Viewer's Image Menu) is used to formulate a mathematical equation to manipulate images similar to using a scientific calculator (Figure 17). Numbers and simple math operators are entered into an equation from the keypad. Images are entered into the equation using 'this' or 'other' buttons. Pressing the Calculate button evaluates the equation, performs the indicated actions, and assigns results to 'this' image or to a 'new' image (new image in Fig 17). The equation can be formulated using numeric values, built-in functions, and images. Recently used equations can be selected from the History listing.
General. The image where the calculator is opened is referenced in equations as 'this'. Other open images are labeled other(n) where 'n' is the order in which they were opened. The 'other' button brings up a list images as other(n) along with file names. When selected other(n) is entered into the equation. In Figure 17 a new image is calculated as the difference between this image and another open image (other(1)). The new image is assigned a name based on this image's name.
Processing Range
The processing range can be adjusted using options for slice range, ROI range, and time series range. The range options can be combined.
Slice Range. There are two alternatives: 1) voxels in all slices as indicated by the Volume option in Figure 17 (the default) or 2) voxels in the Current Slice.
ROI Range. If the current image has selected ROIs there are two alternatives: 1) voxels inside the ROIs (the default) or 2) voxels outside the ROIs. For option 2 the user can choose to only process slices with ROIs. A common use of this option is to set voxels = 0 outside of an ROI for all slices.
Time-Series Range. If the current image is a 4-D image, there are two alternatives: 1) current image volume or timepoint (the default) or 2) all image volumes or timepoints (All Timepoints). If the ROI range is set to outside ROI another time- series range option is provided with two alternatives: 1) only slices with ROIs (Only ROI Slices the default) or 2) all slices.
Make Statistical Image from Time-Series
This option is available in the viewer's Image menu if the current image is 4-D. A single statistical parametric image (mean, max, min, standard deviation, or sum) is output based on voxel analysis in the 4th dimension (time for fMRI images). Processing range is from starting image (or timepoint) to ending image (or timepoint). Statistics can be calculated using group size = 1 to group size = full range. For example if the range is 10 images and group size is 2 the result will be 5 grouped images (in 4-D format) with running stats calculated each group. If group size is the same as the range then only one statistical image is calculated (the default).
Using Mixed Images Array Sizes
Some image math programs require that all images have the same number of rows, columns, slices, and time points (i.e. identical array configurations). However, Mango supports calculations even when these differ. The processing schema is similar to how Mango performs other multi-image operations such as copying an ROI from one image and pasting it into another. In image coordinate mode images are aligned according to row, col, slice, time = 0,0,0,0. In world coordinate mode images are aligned according to x, y, z, t = 0,0,0,0. Mango manages differences in spacing and data types in both of these modes. Calculations are only done where all images overlap, which can vary considerably with mixed array configurations. The array configuration of the resulting image is set to match that of the current (this) image. When images with differing array configurations are used in a calculation we recommend using the world coordinate mode and that each image have a consistent 'origin'.
Mathematical Operations
The math, bool, stats, and misc keys list options for each of these categories.
Miscellaneous (misc)
This option includes several helpful features, added to support a variety of needs, which do not fall within Mango's other math categories. There are four special variables that automatically increment across rows, columns, slices, or time. For example 'new = rows' creates a new image where the value in each row is the row number, resulting in a ramp- like image. These variables can be used in arguments of other functions.
The volume(value) function is used when this image is a 4-D time-series. It returns a copy of a time-series image volume indexed by value. For example 'new = volume(13)' will copy the image (here called a volume) at time point 13 to a new image.
The max(value, value) function returns the maximum value of the two arguments. This function can be used to calculate an image that is composed of the maximum value of two images. For example 'new= max(this, other(2))' will make a new image where each voxel is the maximum of that found in this or the other(2) image. The min(value, value) and remainder(value, value) operations function similarly.
The bin(condition) function returns a binary valued image based on testing a logical condition in the argument (returns 1 if condition is true and 0 if it is false). For example 'new = bin((this >100) and (other(1)<500))' will set voxels in the new image = 1 where voxels in this image are greater than 100 and those in the other(1) image are less than 500. This function is helpful for forming a binary mask for use with other image processing tasks.
The round(value), ceil(value), and floor(value) functions are used to convert a floating point value to an integer. For example if this image has fractional values then 'new = round(this)' will make a new integer image using the 4-5 rounding rule. Similarly, floor rounds down (negative direction) and ceiling rounds up (positive direction).
Statistics Options
The stats option lists functions that return statistics calculated in this image. Two stats categories are provided: 1) ROI stats (selected by color) or 2) Time Series stats (range designated as start and end). The ROI stats functions return a single value and separate functions are provided for minimum, maximum, standard deviation, or sum. For example, 'new = bin(this>meanROI(r))' will make a new binary image based on the condition that this image is greater than the mean value of the red ROI in this image. Time series stats return an image based on the selected stats function. For example, 'new = meantime(5,20)' will return an image that is the mean of images 5-20 in this time series image.
Boolean Options
The bool option lists Boolean operators useful for formulating logical statements (the bool and operator was used in a previous example). Characteristics of Boolean operators are documented in many texts as well as a variety of websites. A particularly useful logical function is if(condition, value else value). For example, 'new = if(this>=other(1), this else 0)' makes a new image with values that are from this image if it is greater than or equal to the other(1) image and equal to zero if not. This effectively uses the other(1) image as a variable threshold for this image.
Math Options
The math options include standard trigonometric functions and their inverses along with common mathematical operations such as absolute value. The value of 'pi' is included since it is often needed with the trigonometric functions. Arguments to trigonometric functions are in radians. For example sin(/2) = 1 and asin(1)= /2 = 1.57... Another example use is 'new = pow(this, 1.67)' which makes a new image by raising each voxel in 'this' image to the 1.67 power. Finally, 'this = sin(2 *row/128)' will make a one period sine wave across the rows of an image with 128 rows.