
Download Using_Mango.pdf
Statistics
The most basic form of image analysis in Mango is a statistical summary of an image or its ROIs (size, max, min, centroid, mean, standard deviation and sum). When Image or ROI Statistics is selected from the viewer's Analysis menu, a new window (Statistics window) is opened tabulating the stats. Stats can be calculated over the entire 3-D image, the current slice, or as a slice-by-slice listing. If multiple ROIs are present, stats will be calculated for each that is selected. Tabulated stats can be copied into another document (word, excel, etc.) or exported to a file with comma-separated values (csv) format for opening in excel. Note: The slice-by-slice option is useful for comparing stats of a convex hull vs. shrinkwrapped ROI of the brain for coronal brain slices.
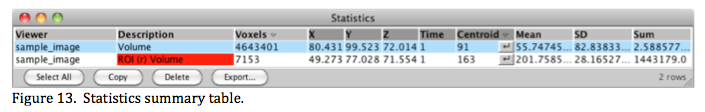
There are two headings that can be toggled in the Statistics window to reveal different data (indicated by a small inverted triangle). The size heading toggles between image (voxels) and physical (mm) units. The column to the right of the Time heading toggles between Max, Centroid, and Min with the location of these values indicated under the x-y-z-time headings. In the example of Figure 13 the image's centroid x-y-z location is given using fractional voxel spacing since it is a weighted average.