
Download Using_Mango.pdf
Display
 When an image file is opened a viewer window automatically displays the image with menus along the top (Figures 3 & 4). Multiple image files can be opened, and each has a dedicated viewer. By default Mango displays images using a linear grey scale. Keyboard options are provided to adjust brightness (cmd>mouse up/down) and contrast (cmd>mouse left/right). Other color tables can be selected (Greyscale inverted, Spectrum, etc.). Color tables such as the 'red-to-yellow' that range between two colors are useful to display overlays placed on a greyscale image.
Layouts
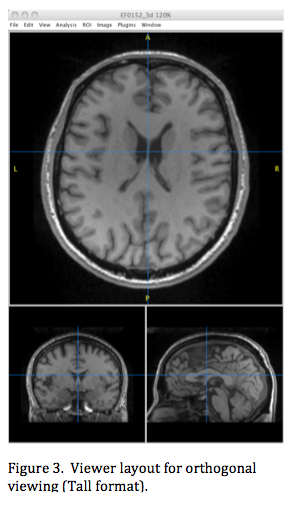
Mango supports several image layouts within a viewer. The default layout for tomographic images has three orthogonal 2-D section images, one as a large view and the other two as smaller views (Figure 3). By default the larger view displays an axial section (x-y) and the two smaller views display coronal (x-z) and sagittal (y-z) views. A large crosshair is available in each view to indicate the intersection point of the three section views. The large crosshair position is changed by pointing and clicking the mouse or dynamically by dragging the mouse. The mouse pointer is a small red open-center crosshair. The pointer's voxel location is displayed in the Toolbox window as (col, row, slice) or (x,y,z) depending on the coordinate mode (image or world) along with the voxel value. The open central portion of this pointer reveals the image where it is positioned.
The larger section view is for user interaction, for example to add regions of interest (ROIs) as points, lines, or 3-D ROIs. Pressing the space bar swaps a different section into the larger view, so the user can work with the most appropriate section. Anatomical directions (left and right, anterior and posterior, and superior and inferior) can optionally be displayed in the larger view (Orientation Option in View Menu). Two orthogonal viewer formats are available: 'wide' with smaller views to the right of the larger view and 'tall' as in Figure 3). These formats are provided to help the user selected the best match for space available on the monitor. This setting can be wide for one viewer window and tall for another, i.e. it is viewer specific. Slice, tall, and wide view settings are accessed from the viewer's 'View' menu.
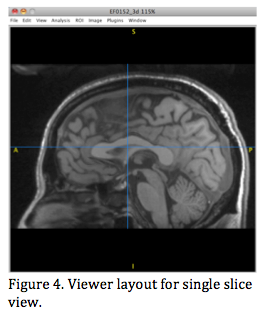 The second viewer layout option is for a single slice in one view (Figure 4). This is the default layout for a 2-D image, such as an optical image or digital chest x-ray. When used with tomographic images, the space bar will toggle between axial, coronal and sagittal sections. Since there is only one view it can be made larger than those of the orthogonal viewer to aid in tasks such as manually tracing a region of interest.
Options
Zooming
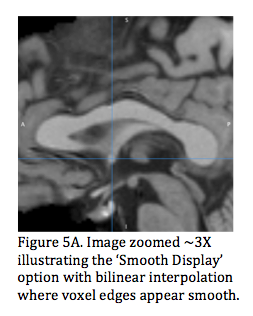
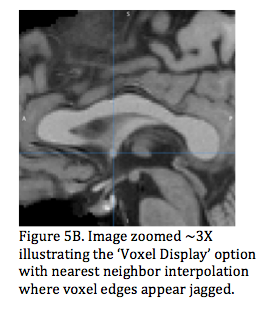 The image viewer window can be enlarged (cmd+) or reduced (cmd-) to provide the preferred viewer size. An option is provided in the viewer's window menu to increase size to the maximum supported by the monitor. Mango provides a quick way to zoom within the views without changing the viewer window size, zooming in and out using (alt_move_mouse up/down) and panning using (shift_alt_drag mouse) [Figure 5]. When enlarging and/or zooming additional pixel values are interpolated for display. Interpolation is only for display purposes and does not affect the image data. Interpolation uses either bilinear interpolation or nearest neighbor interpolation, user selectable preferences in Mango's Toolbox. Bilinear interpolation is recommended for better display quality so that transitions between voxels appear smooth and therefore more natural (Figure 5A). Nearest neighbor interpolation is recommended for older slower computers or if smoothing is not desired (Figure 5B).
Ruler/Angle Tools
Ruler and Angle tools are available in the viewer's 'View' menu to dynamically measure distances and angles. These tools toggle on (when checked) and are displayed in the large slice view. The ruler tool has small handles at each end that can be positioned at image voxel locations. The ruler tool reports distances between its endpoints in units of mm with fractional mm precision. The angle tool is composed of two lines with a common vertex. Similar to the ruler, the endpoints and vertex of the angled lines have handles that can be dynamically moved, positioned at voxel locations. The angle tool reports angles in degrees with fractional degree precision. These tools can be used in combination with an image transform (Image Menu) to make measurements on oblique planes.
Crosshair Settings
The 'View' menu also has options for turning the main and/or smaller view large crosshairs on or off. The large crosshairs are helpful during analysis but most prefer to make pictures with these off. This menu provides ROI viewing options of 'Edge only', 'Mask only', or both (both checked). When both are checked the edge is opaque but the mask (inside of the ROI) is made 50% transparent to reveal the image below. Also, this Menu has an option to display ROI stats for the current slice (checked). This is helpful for reviewing ROI slice-by-slice stats, and also includes ROI area (voxels) and center voxel location. Overlay viewing can be set to all or the current overlay. This is helpful when several overlays are present, and you want to view them individually.
Color Tables
 Color tables determine how image values are displayed. Color table options and associated controls are found in Mango's Toolbox.
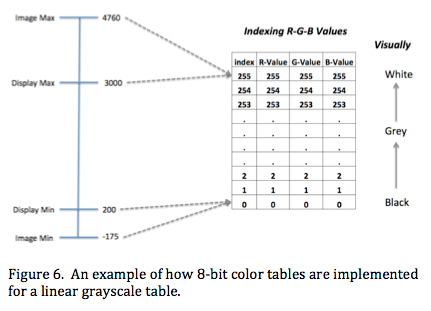
All color tables have settings for red, green, and blue ranging from full off to full on, with 256 levels, indexed from 0-255. Image values are scaled to indices matching this range (Figure 6). Image values less than or equal to Display Min are set to index 0 and those greater than or equal to Display Max are set to index 255. Between min and max the image values are linearly mapped to indices from 0-255. This 256 index range is adequate for biomedical images where the dynamic range (signal max/signal noise) is often less than 100, and sufficient to avoid grayscale contouring in most biomedical images. The linear grayscale RGB table changes linearly from a display level of 0 at index 0 to a display level of 255 at index 255 (Figure 6). Values in the image of Figure 6 range from a minimum of -175 to a maximum of 4760, and the user has set Display Min to 200 and the maximum to 3000. Image values between Display Min and Display Max follow the grayscale table.
Different color tables have different R-, G-, and B-values depending on needs. When images are displayed using non-grayscale color tables (e.g. spectrum color table) the resulting colors are called pseudo-colors. Color tables provided with Mango include those starting with a pure color and ending as white (red to white, etc.), changing from one color to another (red to yellow, etc.), and combinations of colors (gold, spectrum). A special class of color table is used for logical operations with overlays and regions of interest such as ROI A (AND) ROI B. Logical color tables do not vary by index.
The recommended approach to create a new color table is to edit an existing table. As with many new experiences color table editing requires practice, but Mango provides many tools to simplify the task.
Overlays
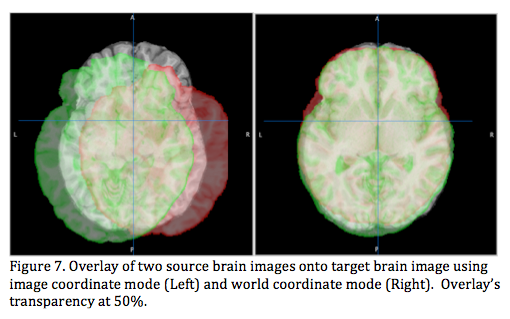 Overlaying one image (source) onto another image (target) is robustly supported in Mango. Up to eight source images can be overlaid onto a single target image, and these can be from different imaging modalities. The source image is interpolated to match dimension and spacing of the target image when overlaying. The coordinate mode determines how source and target images are registered for overlaying (Figure 7). When using 'image coordinate' mode (Toolbox image mode) the origin of the source image is positioned to align that of the target image (col, row, slice=0,0,0) (Figure 7, Left). This works well if the objects within these images are oriented the same and positioned the same distance from this origin, which is not likely without preprocessing.
Overlaying in 'world coordinate' mode (Toolbox world mode) is a unique capability in Mango. In this mode world-space origins (x,y,z=0,0,0) are aligned (Figure 7, Right) for overlaying. This approach is especially useful for overlaying brain images where a standard origin has been adopted, the anterior commissure in the mid-sagittal plane. However, any two objects can be overlaid in world coordinate mode if the origin in each is set to an identical landmark. This assumes that objects to be overlaid are oriented the same.
When multiple overlays are used each is automatically assigned a different color. Color tables can be changed if needed. Color tables for overlays are treated differently from that of the target (underlying) image. The overlay image is not displayed below its Display Min (effectively transparent), but it is displayed according to the color table between Display Min and Display Max. The overlay can therefore mask out the target image, and to deal with this the overlay transparency can be adjusted to show both source and target images (Figure 7). Overlaying can be done in the world coordinate mode even when image array dimensions are much different (In Figure 7: target image 240x320x192 at 0.8x0.8x0.9 mm spacing; red overlay 256x256x256 at 1-mm isotropic spacing; green overlay 220x320x208 at 0.8 mm isotropic spacing). Note: The brain images in Figure 7 were not spatially normalized but did have the same general orientation and the same world coordinate origin (anterior commissure). World coordinate mode aligns objects within images.