
Analysis Menu
 These tools are used to analyze and generate statistical data. Some tools operate across the image, while others are bound by ROIs. All statistics can be exported in CSV format from the menu in the toolbar for spreadsheet software use. Exported files can be e-mailed or transferred from the Image Browser.
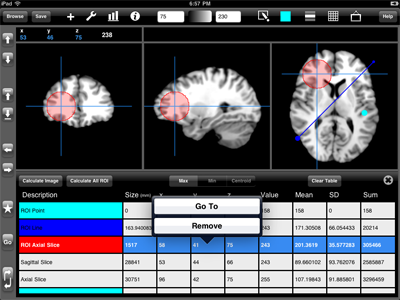
Statistics. Use this tool to calculate image and ROI statistics. Select or to add statistics to the table. Quickly tapping an individual ROI will open the edit menu also providing an option to run a calculation.
The color of the first column represents the color of the ROI that was used in the analysis. If the statistic was not bound by an ROI, the color will be white.
Tap , , or to show the coordinate and value matching this coordinate. Tap a row in the table to display options to the max, min, or centroid or to delete the row.
Tap to remove all rows from the table.
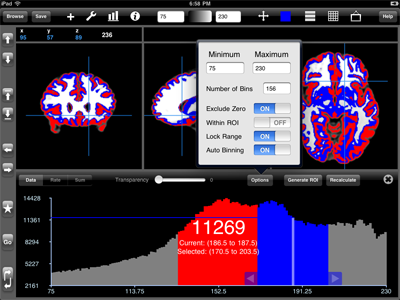
Histogram. Select this option to generate a histogram of the image. Tapping and dragging within the histogram will display the currently selected bin value and range. Grab and drag the arrow sliders to adjust the selected range. Multiple ROI colors can be used to create multiple selection regions.
Select to see the raw histogram counts. Select to see the rate of change or to see the cumulative counts. Adjust to blend the image with the histogram overlay.
Tap the button to change the histogram range and number of bins. Set to affect only those voxels within the selected ROI. will keep the selection range fixed and keep the selected bin centered in this range. Use to reduce histogram artifacts for most images.
will create a new ROI based on the area covered by the histogram selected range. Use to update the histogram when settings have changed.
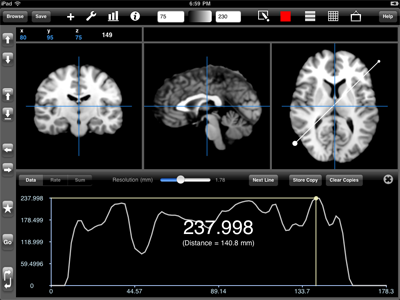
Cross-section. A cross-section displays the image values along a line of interest. Tapping and dragging within the cross-section will display the selected value and distance along the line — a corresponding point is drawn along the line of interest in the image.
Select to see the image values. Select to see the rate of change or to see the cumulative counts. Use to adjust the step size along the line, from which the values are generated.
will cycle to the next line found in the current slice planes. Tap to make a copy of the current data. This can be used to compare cross-sections. Only copies that match in length and resolution are displayed along with the current cross-section. Tap to remove all copies.
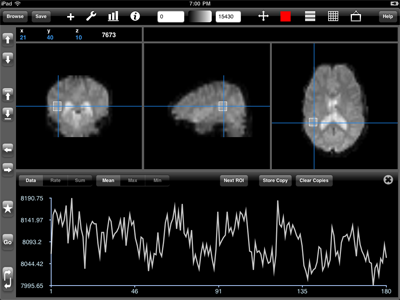
Time-series. A time-series analysis is much like a cross-section, but through time. Not surprisingly, this tool behaves similarly to the cross-section analysis tool.
Tapping and dragging with the time-series graph will display the currently selected timepoint in the viewer.
A time-series analysis can be generated from any ROI mask, line, or point. Select , , or to display that stat — calculated from all voxels within the selected ROI. will cycle through all the available ROIs within the current slice planes.