
Analysis Menu
This menu manages image and ROI statistical analysis.
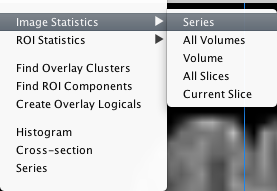
Image Statistics. This menu provides options to perform analysis on the time-series, all the image volumes separately, the current volume, all the slices of the current volume separately (in the direction of the main slice view), or just the current slice.
ROI Statistics. This menu provides options to perform analysis on the ROI across the time-series, all the image volumes separately, the current volume, all the slices of the current volume separately (in the direction of the main slice view), or just the current slice.
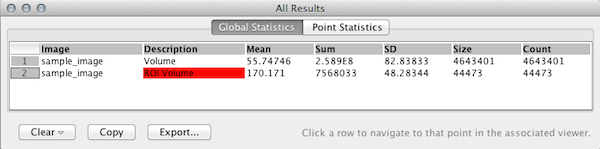
 The statistics window will open automatically any time an analysis
is performed, adding new rows. The columns provide different statistics as well as descriptive information about the analysis. Statistics are split into two tables: Global Statistics (e.g., Mean) and Point Statistics (e.g., Max). Click a row in the Point Statistics table to navigate the viewer to the indicated coordinate. The data can be copied in tab-delimited format or exported in CSV format.
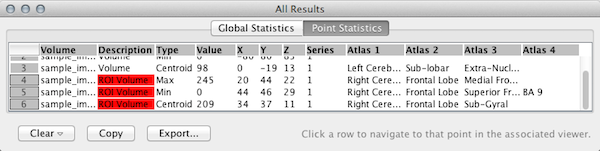
The statistics window will open automatically any time an analysis
is performed, adding new rows. The columns provide different statistics as well as descriptive information about the analysis. Statistics are split into two tables: Global Statistics (e.g., Mean) and Point Statistics (e.g., Max). Click a row in the Point Statistics table to navigate the viewer to the indicated coordinate. The data can be copied in tab-delimited format or exported in CSV format.
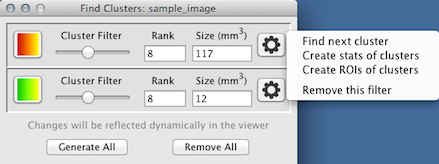
Find Overlay Clusters. This tool can be used to set a cluster size threshold for each overlay. Select Generate All to automatically create a cluster analysis control for all overlays.
Click the options button on the right-side of each combination panel to display options to find, analyze, and create ROIs of the clusters.
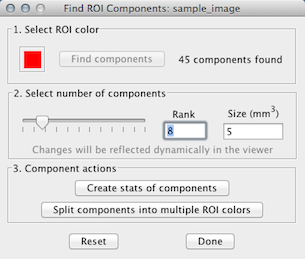
Find ROI Components. This tool can be used to analyze the components of a ROI. The number of ranked components can be selected. An option is provided to delete components below the selected rank and to split the visible components into different ROI colors.
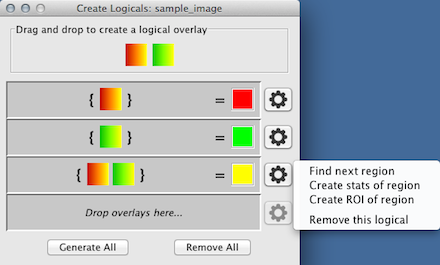
Create Overlay Logicals. Using this tool, overlay images can be combined to show areas of intersection. Drag and drop overlays from the upper panel to one of the lower panels to combine. Select Generate All to automatically create all combinations.
Click the options button on the right-side of each combination panel to display options to find, analyze, and create ROIs from the intersection area.
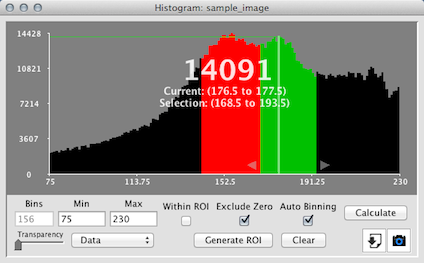
Histogram. Click here to see an introduction to using the histogram.
This window will graph a calculation of the image histogram data. The drop-down box can be used to select among a graph of the original data, the rate of change of the data, or the cumulative sum of the data. Options are provided to change the number of bins, set the minimum and maximum range values, only include values within selected ROIs, and to exclude zero values. Click in the histogram view and drag the arrows to select a region. Change the toolbox color to create multiple regions. Any voxel within this range is automatically overlaid in the viewer with the same color. An option is provided to generate an ROI based on the histogram overlay. A slider is provided to control the transparency of the histogram overlay. Options to export the histogram data in CSV format are also provided. Using the camera button, the histogram image can be captured and saved in PNG format (by default saved in the same folder as the image).
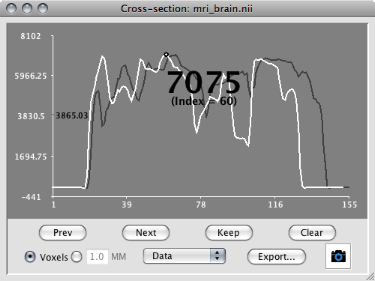
Cross-section. Selected ROI lines will be displayed as cross-section data in this window. Using
the drop-down box, data can also be presented as rate of change or cumulative sum. The currently selected ROI line within the Cross-section window is displayed in white. ROI
line data can be incremented in voxels or millimeters units. In the case of millimeters, the increment size is determined by a multiplier. Clicking and dragging within the graph
will cause the currently selected voxel to be highlighted in the viewer window. Options are provided to navigate through all ROI lines selected within the viewer, as well as to
retain previously selected ROI lines so that they can be compared among others (displayed in grey). Clicking the y-axis will open a window allowing the range of values to be
changed. The cross-section data can be exported in CSV format. Using the camera button, the cross-section image can be captured and saved in PNG format. The file is named
automatically and saved in the same folder as that of the image file, unless [Shift] is held down while the button is clicked.
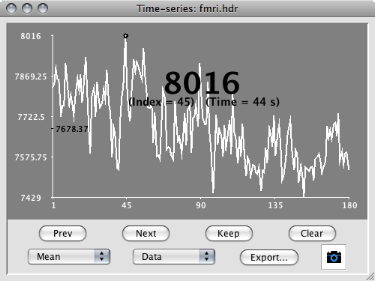
Time-series. If time-series data is loaded, the statistics per volume within selected ROIs (points,
line, or volumes) can be displayed here. Two drop-down boxes are provided: one to select the statistic (mean, max, min, standard deviation, and sum) and one to select among the
original data, the rate of change, or the cumulative sum. Clicking and dragging within the display area will navigate the time-series to the selected timepoint. (The grey vertical
bar represents the current timepoint.) Options are provided to navigate through all ROIs selected within the viewer, as well as to retain previously selected ROIs so that they can
be compared among others (displayed in grey). Clicking the y-axis will open a window allowing the range of values to be changed. The data can be exported in CSV format. Using the
camera button, the time-series image can be captured and saved in PNG format. The file is named automatically and saved in the same folder as that of the image file, unless [Shift]
is held down while the button is clicked.