
Options Menu
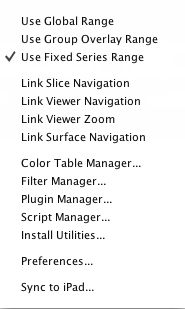
Application options can be managed here.
Use Global Range. If selected, the range controls affect all the viewers.
Use Group Overlay Range. If selected, all overlays in a viewer will use the same range controls.
Use Fixed Time-series Range. If selected, range is maintained across timepoints. If not selected, range changes according to the min/max of each timepoint.
Link Slice Navigation. If selected, navigation is synced among the viewers, but always on the current slice (regardless if the current slice is the same among viewers).
Link Viewer Navigation. If selected, navigation is synced among the viewers. When synced, navigating in one viewer simultaneously navigates (by the same amount and in the same direction) in all other viewers.
Link Viewer Zoom. If selected, zoom is synced among slice viewers.
Link Surface Navigation. If selected, view rotation angles are synced among surface viewers.
Color Table Manager. Color tables (or LUTs) can be managed here. See the Color Table Manager section.
Filter Manager. Filters can be managed here. See the Filter Manager section.
Plugin Manager. Compiled Java classes that implement one of the plugin interfaces recognized by Mango can be registered with the application via this menu option. See the Plugins section.
Script Manager. Record and edit scripts. See Script Manager for more info.
Install Utilities. This tool can be used to facilitate the installation of command-line utilities included with the application. It creates the executable scripts to run the utilities as well as updates shell initialization files. See Command-line Utilties for more information.
Preferences. Application-wide settings can be managed here.
Sync To iPad. Sync data between a local folder and an iPad. See Transferring Data for more information. See the iMango section for more information about the iPad app.
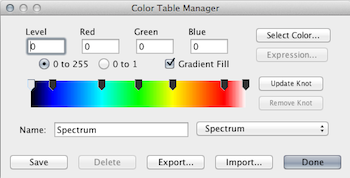
Color Table Manager. This window can be used to create new and edit existing color lookup tables (LUTs). Each knot along the color map is associated with a level, an RGB value, and a gradient state. The gradient option indicates whether the colors should be solid or change linearly between a knot and the knot above it. The RGB value can be edited manually or by selecting from a color chooser. Options are provided to show the knot level and RGB value as a percent or 8-bit value (0 to 255). Clicking a knot will display its current values in the text boxes. Clicking in the color map between knots will create a new knot. Knots can be grabbed and dragged to a new location. Grayscale color tables composed of only a minimum and maximum knot can use an expression to determine their values [see the color table Grayscale (Compressed) as an example]. Options are provided to export and import color table files. For information about the custom color table format, see this document.
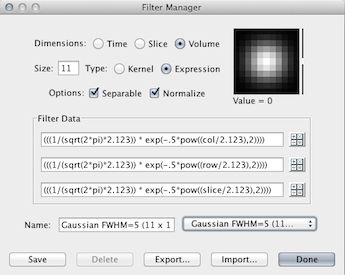
Filter Manager. This window can be used to create new and edit existing filters. A filter can be constructed as a kernel or as an expression. Expressions can use keywords -- col, row, slice, and time -- to indicate the value of the dimension index. A button is provided to open an expression editor, if necessary. Options are also provided to set the size of the kernel as well as to normalize it before processing. Kernels can be one-dimensional (temporal filtering), two-dimensional (slice filtering), or three-dimensional (within and across slice filtering). An option is also provided to indicate that the multi-dimensional filter is separable into one-dimensional kernels (for faster processing). A point-spread image is provided which illustrates the kernel of the currently selected filter. Hovering the mouse over the image will update the value label. If the filter is three-dimensional, dragging the mouse up and down within the point-spread image will move it throughout the third dimension. Options are provided to export and import filter files.