Image Menu
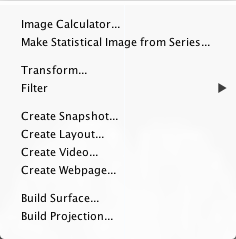
This menu manages image operations.
Image Calculator. This will open the viewer's Image Calculator.
Make Statistical Image from Time-series. If a time-series is loaded, this option can be used to make an image based on the statistics of each voxel across time. Statistics include mean, max, min, standard deviation, and sum.
Transform. This window provides tools to add, edit, and construct image transforms. See the Transform section.
Filter. Loaded filters will appear in this menu list and can be selected to process the image. See the Add/Edit Filter section. An option to construct a rank filter (min, median, max) can also be accessed from this menu.
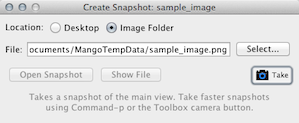
Create Snapshot. Takes a snapshot of the main slice viewer. Options are provided to choose a file location.
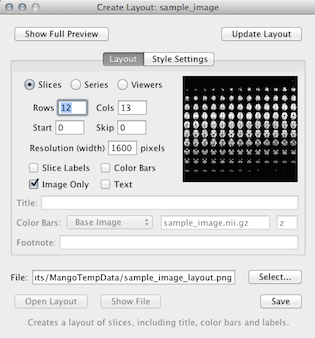
Create Layout. Creates a multi-slice layout of the main slice viewer. Layout slices may come from multiple slices of a single slice volume, slices in a series, or slices from multiple slice viewers. Following changes to the below settings, click .
- Rows – The number of slice rows.
- Cols – The number of slice columns.
- Start – The start slice (0 is the first slice).
- Skip – The slice interval (a 0 would indicate slices 0, 1, 2; a 1 would indicate slices 0, 2, 4; etc).
- Resolution – The pixel resolution width of the output image.
- Slice Labels – If selected, slice labels will be used (see Style Settings).
- Color Bars – If selected, color bars will be used.
- Image Only – If selected, only image data will be used, ignoring things like crosshairs, ROIs, etc.
- Text – If selected, title and footnote will be used.
- Style Settings – This panel provides more options over font, color, and labels.
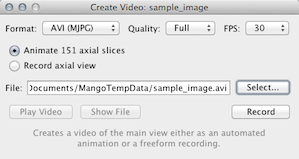
Create Video. Create a video of the main slice viewer. Options are provides to select video container type, compression quality and FPS.
- Animate – If selected, the video will be automatically generated as a fly-through in the main view slice direction.
- Record – If selected, the main slice view will be recorded until the button is pressed.
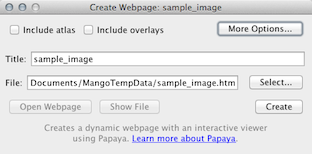
Create Webpage. Create a webpage of the image, including overlays and atlas, that contains an interactive viewer. The default options should be sufficient in most circumstances, but for advanced usage features click the button.
This feature uses Papaya, a JavaScript-based research image viewer. Click here to learn more about Papaya.
Build Surface. This can be used to build a surface from the base image volume. Options are provided to smooth the image, select a surface threshold, and smooth the surface. See the Surface section for more information.
Build Projection. Create an animated maximum intensity projection of the image. Options are provided to select projection plane, rotation axis, resolution and amount of detail.
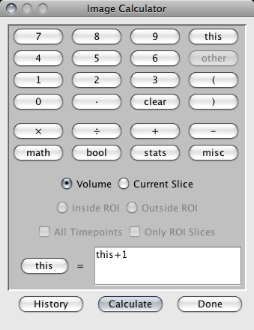
Image Calculator. This window can be used to construct
an image operation using numbers, keywords, and operators. The operation can be performed on every voxel in the volume, only voxels within the current slice, or only voxels
inside or outside an ROI. In a time-series, the operation can be performed in the selected region for the current volume or across all volumes.
This/Other. Within the operation string, the keyword this refers to the value of the current voxel. Values at the same location in other viewers can be accessed using the keyword other (the value is based on the location at the same millimeter distance as the voxel in this image). These keywords can be added using the buttons in the top-right corner of the calculator.
Output to This/New. The output image can either be this or a new image of the same dimensions and type. This option is found to the left of the equals sign.
Operations. The bottom row of buttons provides several kinds of operations: math (e.g., square root, log, sin), bool (e.g., xor, if/then), stats (e.g., mean within an ROI, standard deviation across time), and misc (e.g., generate a random number, get the column index of the current voxel).
Examples. These operations can be combined in many ways to perform simple to very complex operations on the image. The ten most recently used operations are saved and can be accessed via the history button. Here are a few examples:
- this + 1 [adds 1 to every value in the image]
- round(rand(0, 255)) [sets each voxel to a random whole number between 0 and 255]
- this + other(1) + other(2) [adds three images together]
- (this - meanROI(r)) / sdROI(r) [subtracts the mean of the red ROI from each voxel and divides by the standard deviation]
- col * row * slice [creates a gradient based on the voxel indices]
- this >= 100 [thresholds the image at 100]
- if(this >= 50, 100, -100) [binarizes the image at a threshold of 50 using the values 100 and -100]
- sqrt(round(if(this>100, rand(-99, 99) else (if(this==50, this else rand(0, 50)))))) [???]
Transform. This section describes tools useful for image transformation.

This tool can be used to edit the image transform. The viewer is automatically updated as the transform is dynamically modified.
